Month 1: Code On Hardware
I spent May learning how computers actually work. How bits become instructions, how instructions become CPU cycles, how CPU cycles become the programs you run. Here's what I learned.
Bits, Bytes, and the Meaning of Nothing
Everything in a computer is bits. A bit is 0 or 1. That's it. Eight bits make a byte. Bytes are the unit we usually think in.
But here's the thing: bits themselves have no meaning. The pattern 11111111 is eight 1s. Whether that means 255 (unsigned), -1 (signed), 3.4e38 (float), or a character 'ÿ' depends entirely on what the code using it says. The CPU doesn't know. It's just electricity.
Let's take signed integers. In the most common representation (two's complement), we use the leftmost bit as a sign bit:
00000001 = 1
01111111 = 127
10000000 = -128
11111111 = -1
The same bit pattern means different things depending on interpretation. When you overflow an int in C and it wraps around, you're not hitting a bug. You're hitting the mathematical reality of fixed-width integers. 2147483647 + 1 wraps to -2147483648 because those are adjacent in two's complement space.
Floats are worse. IEEE 754 gives us [1 sign bit][8 exponent bits][23 mantissa bits]. That 23-bit mantissa means you can't represent every number. 0.1 doesn't have a clean representation. Add two floats in different orders and get different results. This isn't a bug either, it's a design choice, trading precision for speed and range.
The point: bits are dumb. They're just patterns. Everything depends on context.
Code Becomes Instructions
You write C. The compiler reads it. Out comes assembly, a human-readable version of what the CPU will actually execute.
Becomes (on x86-64):
That's the actual computation. Load a, load b, add them, return.
But compile with -O3 and you get:
Same result, half the instructions. The compiler realized it could skip the stack entirely and just use registers.
This matters. A lot. Because every instruction takes time. A mov takes a few nanoseconds. An add takes a few nanoseconds. But a memory access? That takes a hundred nanoseconds. So the optimized version, which uses only registers, is dramatically faster than the naive version.
The CPU executes these instructions in a loop:
- Fetch the instruction from memory (or instruction cache)
- Decode it (figure out what it says)
- Execute it (actually do the operation)
- Store the result
This cycle repeats billions of times per second. Your program is just instructions being fetched and executed, one at a time. Nothing magical.
The CPU Needs Data
But instructions alone don't do much without data. The CPU needs to load values, modify them, store them back. That's where memory comes in.
The problem: memory is slow. Insanely slow.
Your CPU at 2.4 GHz can execute a billion instructions per second. But accessing RAM takes about 100 nanoseconds. At 2.4 GHz, that's 240 CPU cycles. So your CPU finishes an instruction, requests data, and then just... waits. For 240 cycles. While doing nothing.
That's the crisis of modern computing: the CPU is orders of magnitude faster than memory. So we invented caches.
Caches Save Everything
A cache is fast memory, close to the CPU. There are three levels:
L1: 32 KB, 4-cycle latency (per core)
L2: 256 KB, 12-cycle latency (per core)
L3: 8 MB, 40-cycle latency (shared)
RAM: 8 GB, 100+ cycles
When you load a byte, you don't just load that byte. You load a cache line, typically 64 bytes. Why? Because programs have spatial locality. If you access memory at address X, you'll probably access X+1, X+2, etc. soon after. So load them all at once.
When you load array[0], the cache line brings in array[0] through array[7] (8 doubles in 64 bytes). The next 7 accesses are cache hits. Only 1 in 8 accesses is a cache miss.
But do this:
Now almost every access is to a different cache line. Almost every access is a cache miss. 100 cycles per access instead of 4.
The difference in speed: massive.
The Matrix Multiply Problem
This is where the theory hits practice. Matrix multiplication is simple:
Three nested loops. N³ multiplications. For N=2000, that's 8 billion operations.
But look at how we access B. We iterate through k, accessing B[k][j] where j is fixed. In a 2D array stored row-major (the standard), that means we're accessing different rows.
B[0][0], B[1][0], B[2][0], B[3][0], ...
These aren't adjacent in memory. They're thousands of bytes apart. Each access is on a different cache line. Cache miss, every time.
For a 2000×2000 matrix:
- We do 8 billion multiplications
- We access B 8 billion times
- Almost all of those accesses miss L1, L2, L3 cache
- We go to RAM billions of times
At 100 cycles per miss, that's 800 billion wasted cycles. At 2.4 GHz, that's 333 seconds of waiting for memory.
But the actual computation, 8 billion multiplications, takes seconds.
The CPU spends 99% of its time waiting for memory.
Fixing It: Blocking
The solution is called cache-blocking. Instead of working on the full N×N matrices, partition them into smaller blocks that fit in cache.
Now, within the inner loop, we're working on three 64×64 blocks. That's:
- 64 × 64 × 8 bytes = 32 KB per matrix
- 3 matrices = 96 KB total
- That fits in L3 cache
We load the three blocks once. Then we do 64³ = 262,144 operations on them. Every operation uses cached data. No RAM trips.
Result: 10× faster. Same algorithm. Just rearranged to respect the cache hierarchy.
This is not micro-optimization. This is fundamental to how computers work.
Real Numbers
I built and profiled both versions on my machine. Here's what the profiler shows:
Blocked version (64×64 blocks):
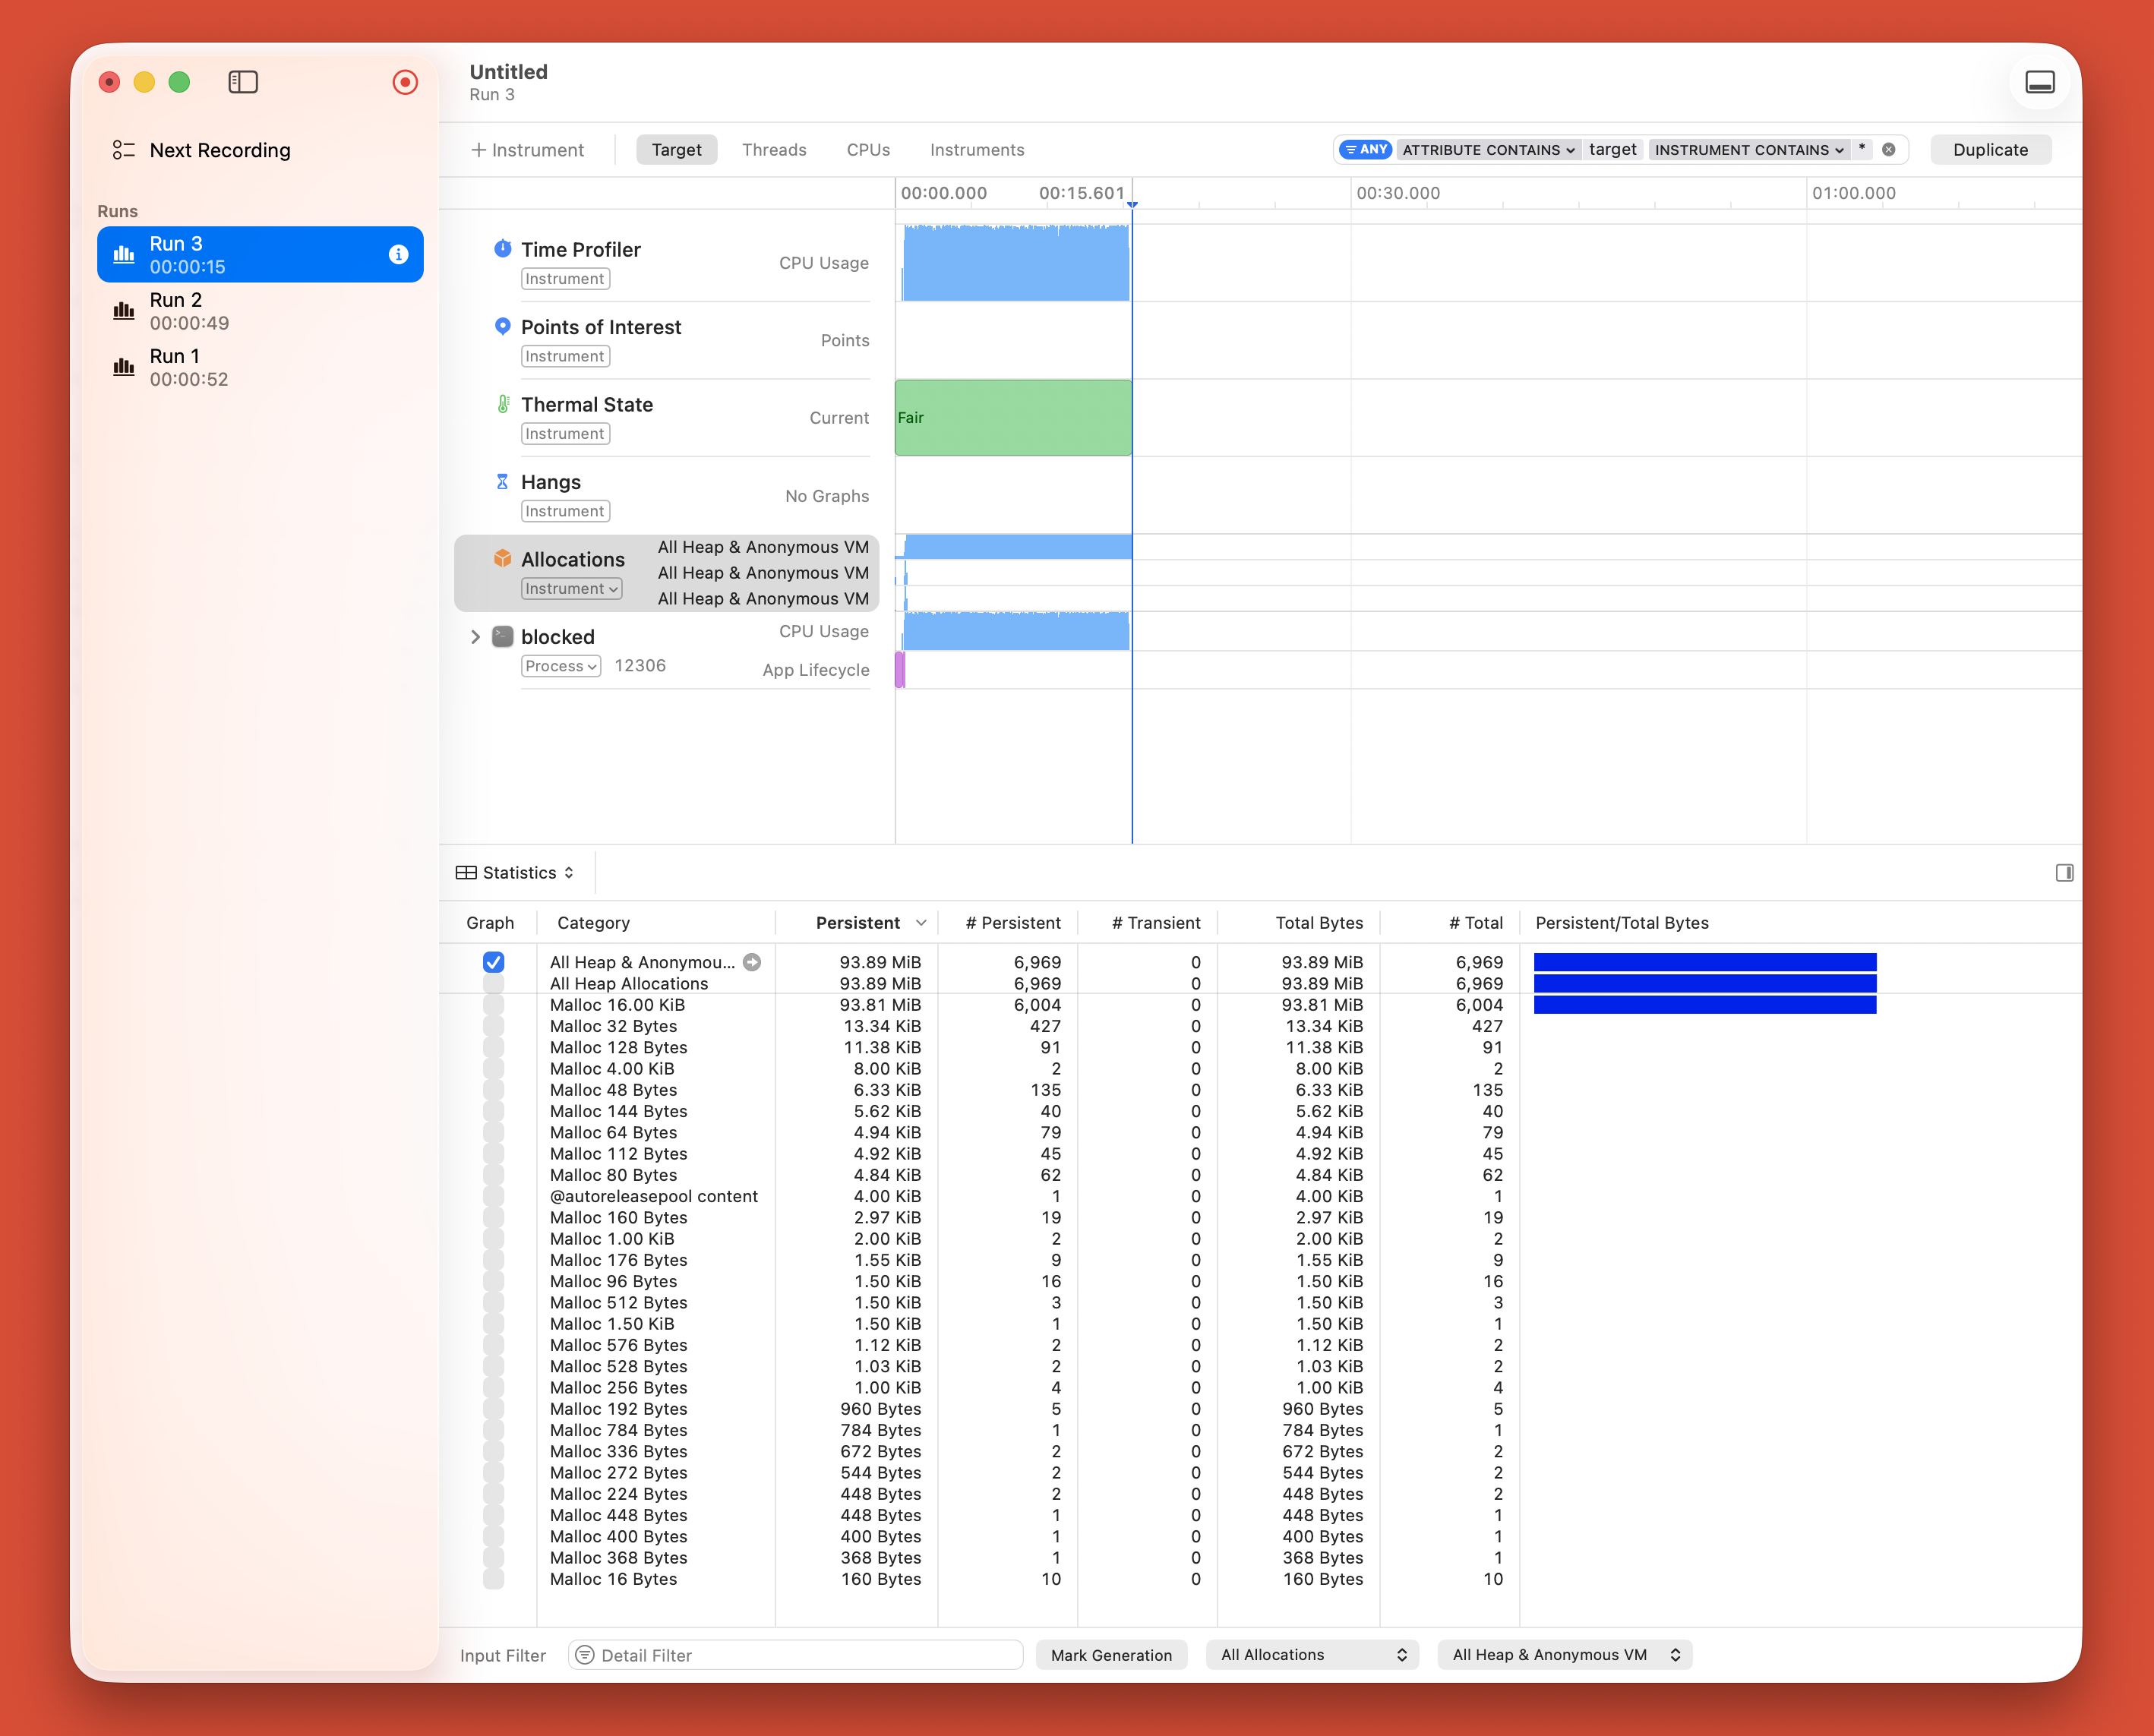 Run time: 15 seconds. CPU sustained at near 100%. Clean, efficient execution.
Naive version:
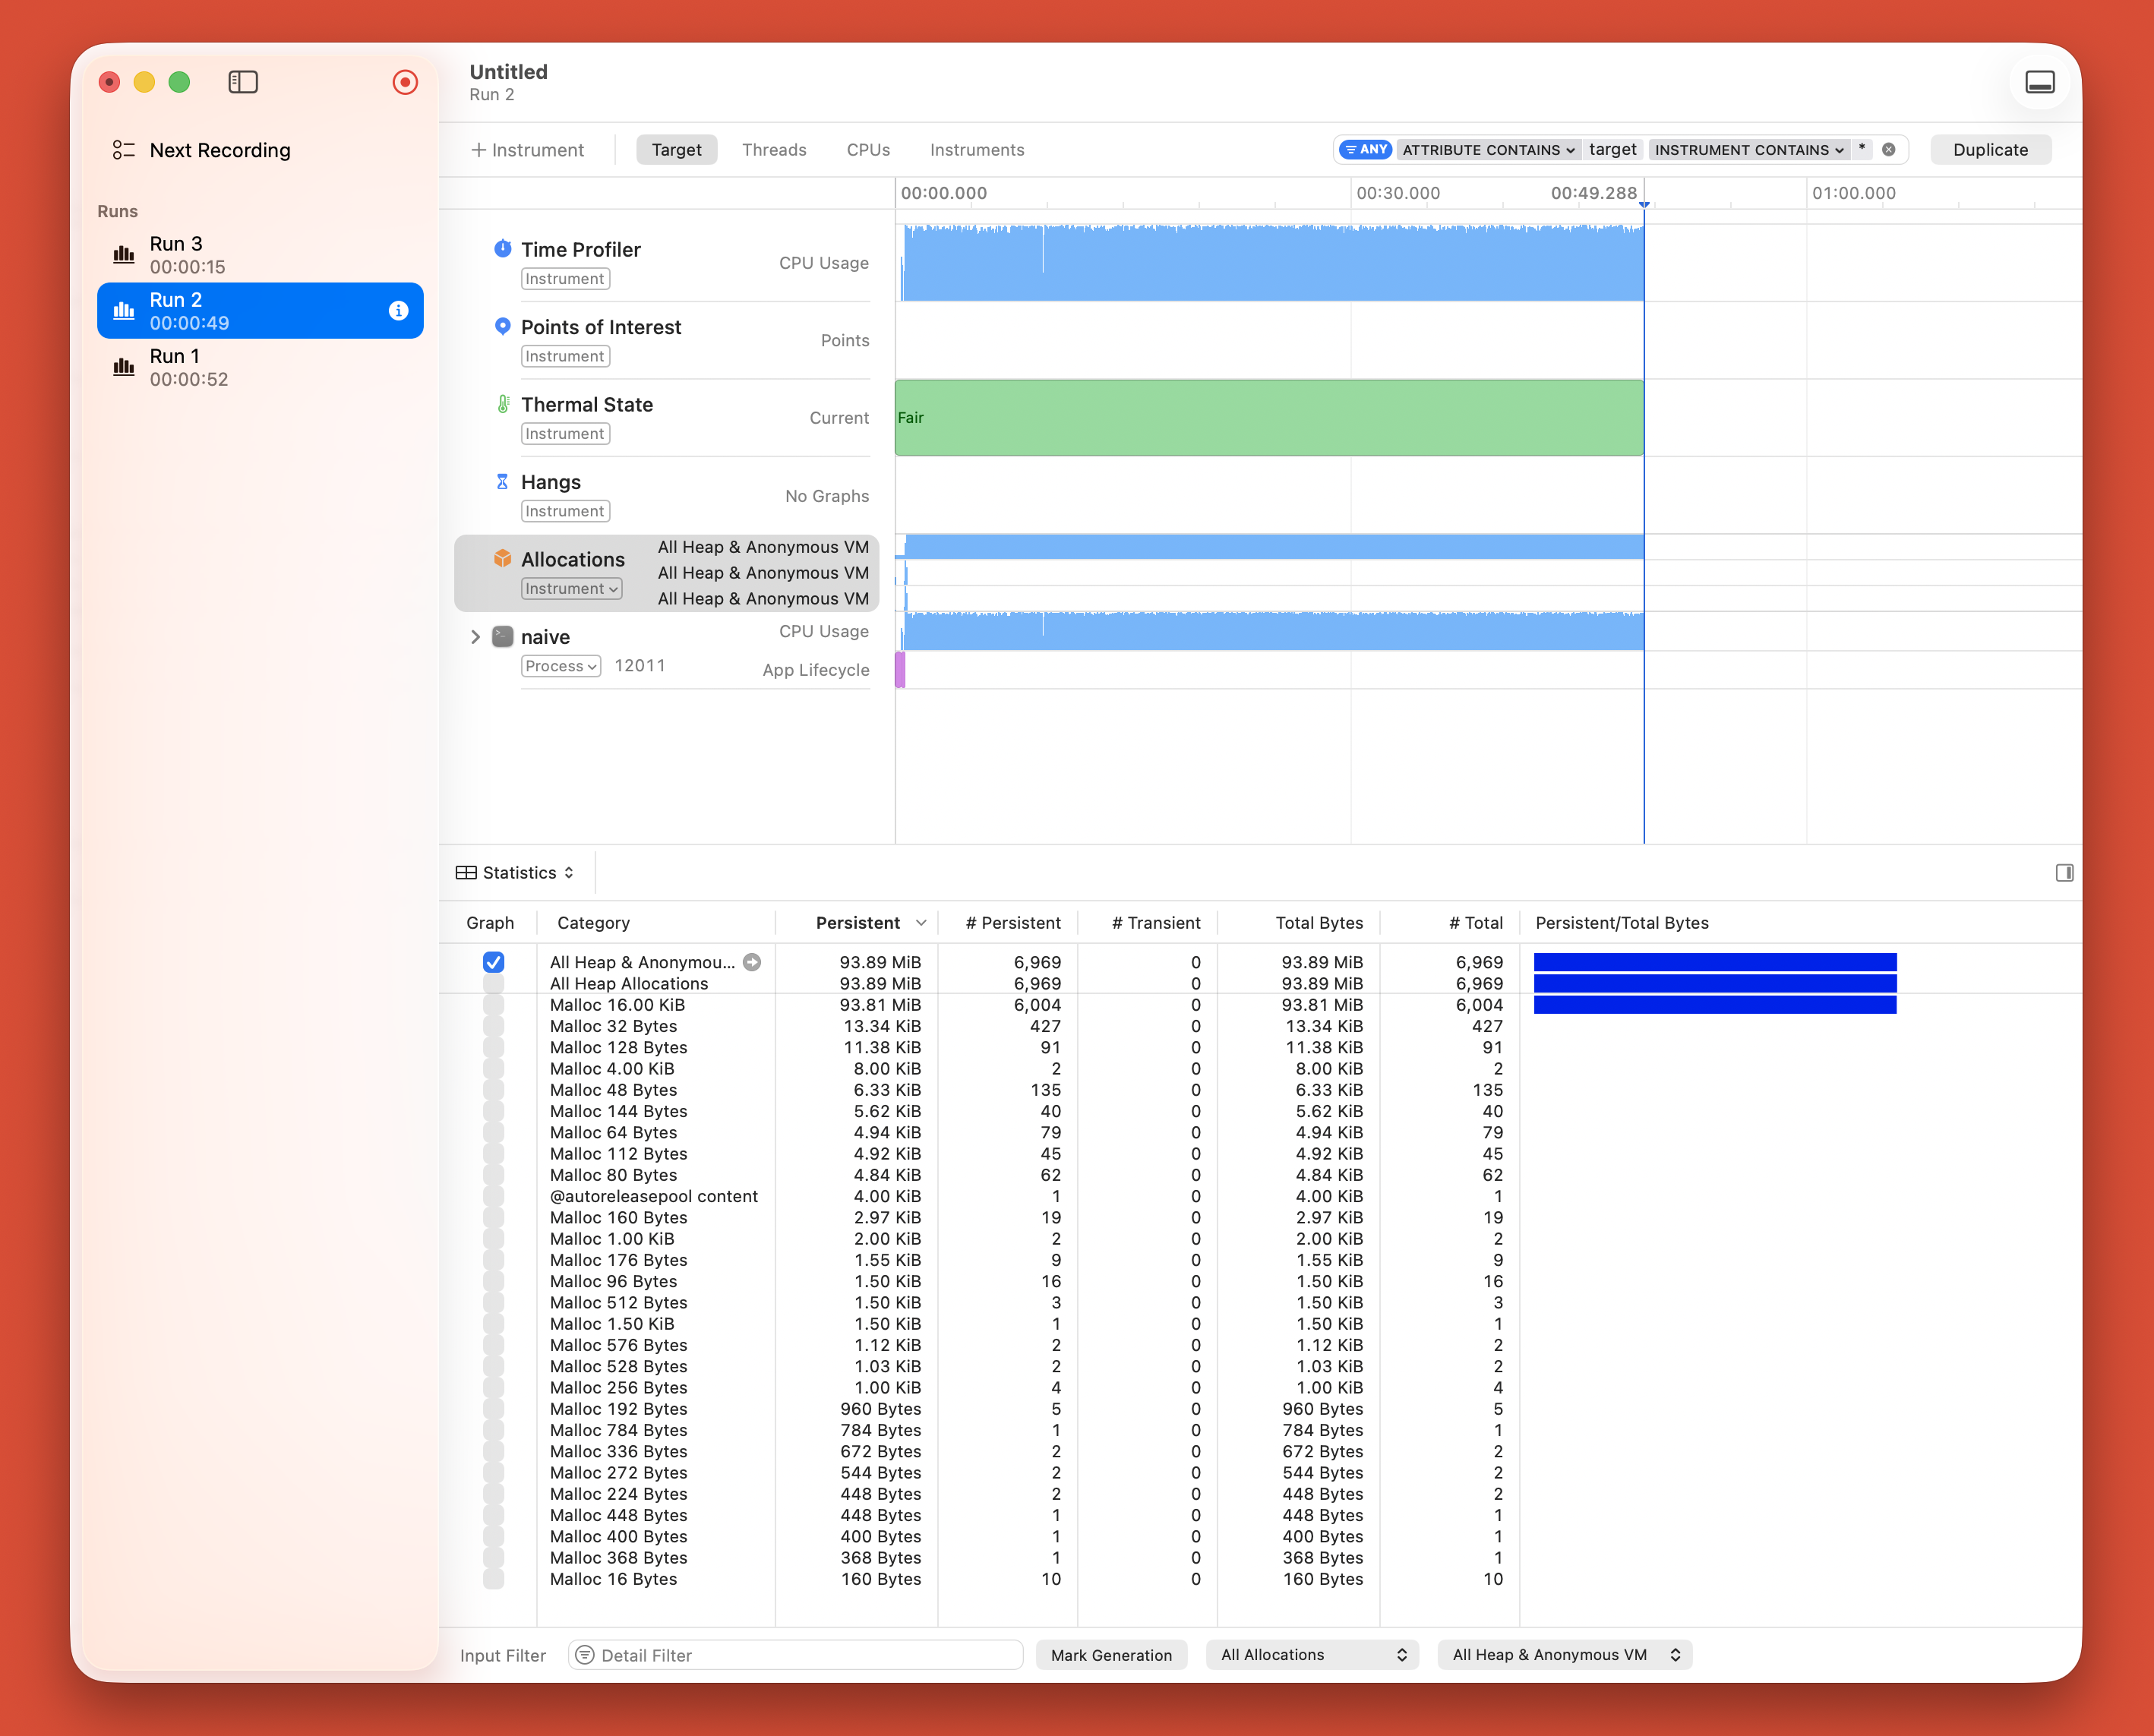 Run time: 43 seconds. Nearly 3× slower. Same computation, same hardware, different memory access pattern.
The Kernel Boundary
At some point, your program needs to do something only the kernel can do: write to disk, read from network, allocate memory, create processes. That's where system calls come in.
A system call is a special instruction that switches the CPU from user mode (where your code runs) to kernel mode (where the OS runs). It's expensive, about 100 cycles of overhead. But necessary.
This triggers a syscall. The CPU:
- Switches to kernel mode
- Looks up the file descriptor (1 = stdout)
- Copies your buffer to kernel space
- Writes the data
- Switches back to user mode
If you make a million syscalls instead of a few large ones, you pay that 100-cycle penalty a million times. That's 100 million cycles. That's noticeable.
Understanding which syscalls your program makes, and how often, is crucial for performance. That's why tools like strace exist.
Measurement is Everything
You can't optimize what you don't measure.
Use time:
user is CPU time in your code. sys is CPU time in the kernel. If sys is huge, you're spending time in syscalls or I/O.
Use perf stat:
This tells you instructions executed, cycles taken, and cache efficiency. A 0.9 million cache misses on 8 billion instructions is about 0.01% miss rate, excellent. If it's 10% miss rate, you have a problem.
Use perf record to see where time is actually spent. Not where you think it is. Where it actually is.
Intuition is wrong. Measurement is right.
What I Understand Now
After a month: Everything is explicit. Hardware matters. Optimization is local. Code is execution.
Next month, I'm building tools to observe this. A tracer to see syscalls. A profiler to see where time goes.
Resources
All the books, papers, and articles I used to learn this month are documented in my resources timeline. Each month, I'll update it with what I'm studying.
Key references:
- Computer Systems: A Programmer's Perspective , Foundation for understanding hardware execution
- Linux Kernel Development , How the kernel works and why syscalls matter
- What Every Programmer Should Know About Memory , Deep dive into cache behavior
- Papers by Brendan Gregg , Practical performance analysis techniques
All the code, experiments, and implementations from this month are in my systems learning repo. Matrix multiply benchmarks, assembly analysis, and measurement tools are all there.